Chapter 5 of 7 · Solar and batteries
Solar and batteries: fast to build, but short of a winter night
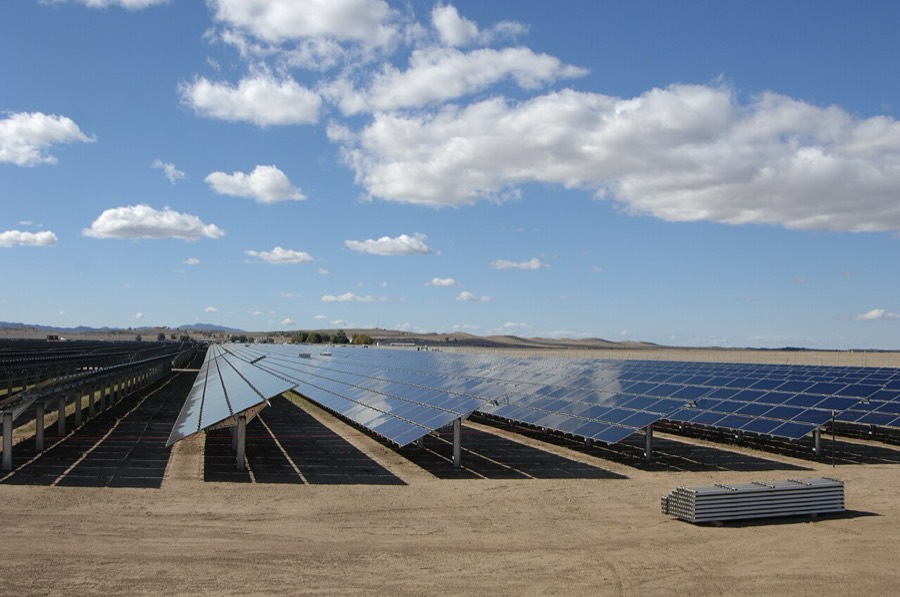
In 2026 America planned to add 86 gigawatts of new power plants, a record if it happens. Solar farms were 43.4 gigawatts of it and batteries 24 gigawatts. Gas, the fuel AI campuses keep turning to, was 6.3 gigawatts.
So the fastest-growing power on the American grid is the kind an AI company could, in principle, build for itself in a year or two. Yet when PJM, the grid operator from Chicago to Virginia, adds up how much it can rely on, it counts a megawatt of tracking solar as 7 per cent of a megawatt.
That is the claim of this piece. Solar and batteries are the quickest power to build, but an AI data centre draws power through every hour of every winter night, and those are the hours solar cannot reach and batteries cannot last. The grid already prices the gap, and its price is getting steeper, not gentler.
The analogy
Think of a data centre as a hospital kitchen that must serve meals every hour of the day and night. Solar is a cheap market stall that opens only around midday, and for even shorter hours in winter. A battery is a lunchbox: it carries the stall's food into the evening.
No lunchbox lasts through a long winter night, still less a week of snow. So the kitchen still needs a supplier who delivers at 3am, and those suppliers are already booked.
Why not just build solar and batteries?
Because that is exactly what America is building, and it builds them faster than anything else.
The Energy Information Administration (EIA), the government’s energy statistics office, counted 86 gigawatts of plants planned for 2026. Solar was 51 per cent, batteries 28 per cent, wind 14 per cent and gas about 7 per cent. In 2025, the last full year, America added 56.6 gigawatts, of which 29.5 gigawatts were solar and no new nuclear.
They are quick because they are simple. A solar farm is rows of panels on posts, and a grid battery is shipping-container cabinets of lithium-ion cells on a concrete pad. Neither has a boiler, a turbine or a cooling tower. In the EIA’s own planning assumptions, a four-hour battery takes one year to build, a solar farm two, a simple gas turbine also two, a combined-cycle gas plant three and a nuclear plant six.
That is the case for solar, and it is real. The earlier chapters showed the grid making new campuses wait years for a connection, and the gas turbine makers selling places for 2032. Solar and batteries still wait in the same connection queue and for the same transformers, but they are the one route that skips the turbine makers’ queue.
How much of the year does a solar farm actually produce?
About a quarter of what its size suggests, and far less in winter.
The measure is the capacity factor: what a plant actually produced in a year, as a share of what it would have made running flat out every hour. America’s large solar farms reached 24.0 per cent in 2025. Its nuclear plants reached 91.1 per cent and its efficient combined-cycle gas plants 58.7 per cent.
The yearly figure hides the season. Solar’s capacity factor was 31.9 per cent in June and July 2025, and 13.1 per cent in December, when the days are short and the sun is low. Nuclear, in that same December, ran at 99.2 per cent.
A solar farm makes about a quarter of what it could, and an eighth in December
Capacity factor by month, United States, 2025: output as a share of running flat out
Turned round, the numbers say how much solar it takes to match one megawatt of steady output. Over the whole year it takes about 4.2 megawatts of panels; in December it takes about 7.6. That is only the average, before any of it is stored, and before the night is covered at all.
What does an AI data centre need from it?
The same power at 3am as at 3pm.
The California Energy Commission, which reads the meters of the state’s existing data centres, published their average hourly load in August 2026. On a winter weekday they drew about 83 per cent of their own peak at the lowest point of the night and about 86 per cent in mid-afternoon, my reading of its chart. Summer weekdays ran higher, about 88 to 94 per cent, and weekends about 85 to 87: never far from flat. These are California’s existing data centres rather than AI campuses, but none of them empties at night.
That flatness is what makes a data centre attractive to a grid and hard to serve with sunshine. An office tower empties at night. A data centre training or answering a model does not empty either, and every hour it runs short is an hour of costly chips losing value unpowered, the pressure that pushes campuses to build their own power.
A four-hour battery reaches the evening; nothing on the site reaches the night
A winter weekday at a solar-powered data centre, schematic
What can a battery cover, and what can’t it?
A battery moves a few hours of solar into the evening. It cannot carry a winter night, and it cannot recharge itself in the dark.
A battery’s duration is how many hours it can deliver its full rated power before it runs empty. The standard grid battery is four hours; the EIA’s planning model assumes exactly that, and found that batteries of four to eight hours are “typically cycled once per day”. Charged by midday sun, a four-hour battery covers roughly the early evening.
A December night lasts about fifteen hours from sunset to sunrise in the northern states. To carry a flat load through it, a battery must hold fifteen hours of that load and be refilled the next day by a sun that, in December, works at about an eighth of its rating nationally, and less in the north. One grey day breaks the cycle, and a week of cloud breaks it for a week.
Researchers at the University of California, Berkeley, modelled solar, batteries and some gas serving a constant load at 68 existing power plant sites near planned data centres, using eight years of hourly weather. Their headline finding cuts against this piece: solar and batteries met more than 95 per cent of the load, with gas covering the rest. But the last few per cent was the hard part, and they found that backup is needed “primarily during winter nights”. Their working paper, published in February 2026, has not been peer reviewed.
How does the grid count a megawatt of solar?
As a small fraction of a megawatt, because the grid’s risky hours are winter mornings and evenings.
Grid operators run capacity markets to make sure enough power will be there at the worst moment, years ahead. To compare plants, PJM rates each kind by its effective load carrying capability, or ELCC: the share of a plant’s size that counts as firm, judged by how much it would actually help in the hours when supply runs short.
For the auction that opens on 9 December 2026, covering June 2029 to May 2030, PJM rates nuclear at 96 per cent. A combined-cycle gas plant counts for 75 per cent, a four-hour battery for 57 per cent and onshore wind for 37 per cent. Tracking solar, panels that turn to follow the sun, counts for 7 per cent, and fixed solar for 6. Tracking solar has halved since the 2025/26 auction, when it counted for 14 per cent.
PJM counts a megawatt of solar as 7 per cent of a firm one
Share of each megawatt PJM counts as firm capacity, auction for June 2029 to May 2030
Turned into a measure, one firm megawatt takes about 14 megawatts of tracking solar, or about 1.75 megawatts of four-hour batteries, or 1.04 megawatts of nuclear. That is my arithmetic from PJM’s ratings, and it is the running measure of this piece: megawatts needed per firm megawatt. It holds at the margin only: an ELCC is what the next megawatt of each kind adds in PJM’s model, with its weather years and its mix of plants, not a fixed property of a solar panel.
The reason is in PJM’s own study of October 2026. In its model for 2029/30, winter holds 96.3 per cent of the energy the grid expects it might fail to supply. Those shortfalls come around the winter morning and evening peaks, when the sun is low or down. In PJM’s run for 2028/29, a fixed solar farm delivered 4.7 per cent of its rating in those hours and a tracking one 7.6 per cent.
Why does each new battery count for less?
Because batteries are rated on the same winter hours, and the more of them there are, the longer the hours they are asked to cover.
The first batteries on a grid shave a short evening peak, and for that job four hours is plenty. As more are added, the remaining shortfalls are the long ones: a cold spell when gas plants trip, lasting most of a day or more. PJM’s main reason is the cold itself: its winter risk lasts many hours because of “flat load shapes” and the long outages of gas and other plants in cold weather. Its model adds a second: “storage resources cannot charge other storage resources during winter energy-constrained events in the model.” A battery emptied on the first evening of a polar vortex has nothing to refill it overnight.
So PJM expects its ratings to move against storage as storage grows. The binding ratings have not fallen yet: 59, 50, 58, 59 and 57 per cent across five auctions. The fall is in PJM’s preliminary ratings, published in September 2026 and not binding, take the four-hour battery from 57 per cent for 2029/30 to 42 per cent the year after, 23 per cent by 2035/36 and 19 per cent by 2042/43. Tracking solar stays at 7 to 8 per cent, and nuclear above 90 per cent, throughout.
PJM expects each new battery to count for less
Share of a megawatt PJM counts as firm, by delivery year
This is the climax of the argument, in the grid operator’s own numbers. In the measure of this piece, a four-hour battery needs 1.75 megawatts per firm megawatt today and about 4.3 megawatts by 2035/36 on PJM’s preliminary rating. The faster America builds batteries, the more of them it takes to make one dependable megawatt.
PJM’s own study shows how much rides on its assumptions. Modelling new large loads, data centres among them, as running steadily all year lifts the 2029/30 battery rating from 57 to 66 per cent; so does leaving out the single cold winter of 1993/94. The direction holds in every run, but the size of the penalty is a modelling choice.
What does the grid’s capacity auction show?
That firm power is short, and solar barely registers in it.
PJM’s last auction, for June 2028 to May 2029, cleared at its price cap of $325 per megawatt per day, in results PJM published on 14 July 2026. It secured 138,318 megawatts in the auction, and 149,182 megawatts with utilities’ own committed plants, still 6,831 megawatts short of its reliability requirement, and PJM’s release cited large data centre loads in its forecast. Of everything cleared, gas was 46 per cent, nuclear 20 per cent and coal 18 per cent. Solar, the largest thing America is building, was 1 per cent, a share that already reflects its low rating.
PJM’s study draws the consequence. Replacing retiring coal and gas with solar and four-hour batteries means the grid “requires more total ICAP”, installed capacity, “to serve the same peak load”. Building fast and building firm have come apart, and that gap is part of what the capacity charge every customer pays now prices.
What are the AI companies actually building?
Solar parks, firmed by something else.
Google has gone furthest. In December 2024 it agreed with Intersect Power, a developer of solar and battery plants, to build data centres beside new clean power, to cut “both the timeline to operation and the amount of new transmission required”. The first park, Quantum in Haskell County, Texas, began operating in June 2026: 640 megawatts of solar and 1.3 gigawatt-hours of batteries beside a Google campus under construction. Google’s owner, Alphabet, agreed in December 2025 to buy Intersect and completed the purchase in March 2026.
The second park shows the limit. Meitner, in Gray and Roberts Counties, Texas, was announced on 4 June 2026 with more than a gigawatt of wind, solar and batteries planned. “The majority of the site’s power will come from clean energy starting on Day One,” Intersect said, “with a minority share of the site’s demand met by firming on-site gas to ensure reliable operations.”
The third park makes the gap plainer still. Roman, in the Texas Panhandle, is off-grid: no connection to the wider grid at all. In a case study published on 14 October 2026, Intersect said Roman’s primary power comes from wind and solar, backed by batteries. “Flexible gas reciprocating engines firm the generation when wind, solar, and batteries can’t carry the load,” it added. Intersect expects Roman’s yearly carbon emissions to be at least half below what its air permit application assumes, because that application, filed with the Texas Commission on Environmental Quality, assumes the gas runs around the clock.
That is the firm-power gap, in the builder’s own words. The permit application assumes the engines run every hour, even though Intersect plans to run them only when wind, solar and batteries fall short. All three parks are in Texas, whose grid, ERCOT, rates plants its own way; the ratings above are PJM’s. But even the company most committed to solar-powered campuses pairs it with gas to keep the lights on. And that gas comes from the same turbine and engine queues the earlier chapter described.
What does the tax law change?
It puts a deadline on solar’s speed and leaves batteries’ subsidy in place.
The One Big Beautiful Bill Act, signed on 4 July 2025, ends the two main clean electricity tax credits for wind and solar plants placed in service after 31 December 2027. The cut-off does not apply to plants whose construction began by 4 July 2026. Since September 2025 the Internal Revenue Service has also required real physical work, not just spending, for most solar plants to count as started.
Batteries are exempt from that cut-off. Their credits run at full value for projects begun by the end of 2033, then fall away by 2036. But a battery project begun since January 2026 loses its credit unless at least 55 per cent of the cost of its manufactured parts, rising to 75 per cent after 2029, is free of material from a “prohibited foreign entity”, a rule aimed chiefly at Chinese suppliers.
So the fastest power to build now has a clock of its own. A solar farm that missed the July 2026 start must be running by the end of 2027 to keep its credit, and after that it competes unsubsidised.
So where does the firm megawatt come from?
From plants that run in the dark: gas, which is booked out, and reactors, which already exist.
Solar and batteries will keep growing, and they cut the fuel a gas plant burns on sunny days. Some AI campuses will run on them for most of their hours. But the hour that sets a campus’s date is the one where everything else has failed, and in America that hour is a winter night.
On PJM’s numbers, nuclear needs 1.04 megawatts per firm megawatt and tracking solar about 14. That gap is why the companies that most want clean power, Microsoft, Google, Amazon and Meta, have signed for old reactors that run nine tenths of the year, on top of the solar they already buy.
What would prove me wrong
Two tests break the claim, and both resolve within a year. If PJM rates a four-hour battery at 50 per cent or more for the 2030/2031 auction, or above 40 per cent for 2031/2032, its ratings have not moved against storage as I expect. And if it rates tracking solar above 10 per cent in either year, the grid has found more firm value in the sun than I expect. PJM’s preliminary ratings say 42 and 34 for the battery; the risk to me is a change in how PJM models data centre load, which its own study shows can add nine points.
Some events would move me before either test. PJM rating an eight-hour battery above 75 per cent in an auction (it rates it 69 for 2029/30). A second Google park announced without any firming gas. Or PJM shifting its risk back from winter to summer, where solar is strong.
Three things would not move me. More solar built: the claim is about firm value, not volume. A campus planned to run mostly on clean power: Meitner and Roman are, and both still plan firming gas. And cheaper batteries: price changes the number of batteries bought, not the hours a four-hour battery lasts.
The claims on record, word for word
Solar and batteries: fast to build, but short of a winter night (9 November 2026)
Claim: “Solar and batteries are the fastest power America builds, but PJM’s riskiest hours are winter nights, when an AI data centre still draws nearly its full load, and PJM expects each new four-hour battery to count for less: in its class ratings, four-hour storage will be below 50 per cent of a firm megawatt for the 2030/2031 Base Residual Auction and at or below 40 per cent for 2031/2032, lower than in any auction so far, with tracking solar at 10 per cent or less in both.”
Breaks if: “PJM rates four-hour storage at 50 per cent or more in its ELCC class ratings for the 2030/2031 delivery year or above 40 per cent for 2031/2032, or rates tracking solar above 10 per cent in either year.”
The figures behind the charts
What America builds. EIA, Today in Energy, 20 February 2026 (EIA-860M, December 2025 data): 86 GW planned for 2026, “a record if realized”; solar 43.4 GW, batteries 24 GW, wind 11.8 GW, natural gas 6.3 GW (combined cycle 3.3, combustion turbines 2.8). Shares 51, 28 and 14 per cent as EIA gives them; gas about 7 per cent, my division. EIA Electric Power Annual 2025, Table 4.6, net summer capacity: 2025 additions 56,609.0 MW, solar 29,459.1 MW, wind 6,082.0 MW, natural gas 4,589.6 MW, no nuclear. Lead times: EIA, Assumptions to the Annual Energy Outlook 2026, Electricity Market Module (April 2026), Table 3: battery storage (four-hour lithium-ion) 1 year, solar PV with tracking 2, industrial frame combustion turbine 2, combined cycle 3, nuclear 6. These are modelling lead times and exclude the interconnection queue.
Capacity factors. EIA Electric Power Monthly, Tables 6.07.A and 6.07.B (released 23 October 2026). 2025: nuclear 91.1%, combined cycle 58.7%, wind 33.8%, solar photovoltaic 24.0%. Monthly 2025, solar: 16.2, 18.7, 23.6, 27.5, 29.3, 31.9, 31.9, 29.7, 26.7, 22.4, 16.9, 13.1. Nuclear: 98.3, 93.6, 85.4, 81.8, 84.9, 93.4, 96.7, 96.6, 92.4, 81.0, 90.2, 99.2 (spring and autumn dips are refuelling). My arithmetic: 1 ÷ 0.240 ≈ 4.2; 1 ÷ 0.131 ≈ 7.6.
Data centre load. California Energy Commission, staff presentation on data centre data collection and forecasting, Demand Analysis Working Group, 12 August 2026, slide 10, “Hourly Load Factor Profiles (2025 IEPR)”, from metered (AMI) data; hourly load factor is hourly consumption divided by the data centre’s own peak. Winter weekday, my reading of the chart: lowest about 83% around 3am, highest about 86% around 3pm; summer weekdays about 88 to 94%, weekends about 85 to 87%. Existing California data centres, not AI campuses. The CEC’s earlier deck (21 November 2024) puts data centre peak demand at about 67% of installed capacity, so the line is flat against its own peak, not against its nameplate.
Batteries. EIA, Today in Energy (25 March 2022): batteries of four to eight hours “are typically cycled once per day”; fleet built to 2020 averaged about 3.0 hours. Night length is my approximation for the northern states in December (sunset about 16:30, sunrise about 7:30). Berkeley: Chojkiewicz, Manocha, Paliwal, Callaway and Phadke, Energy Institute at Haas working paper WP-356 (February 2026), not peer reviewed: 68 plants, eight years of hourly weather, constant load; solar and storage met more than 95% of it; “backup for a solar+storage system supplying a constant load occurs primarily during winter nights”.
PJM ratings. ELCC class ratings, per cent of nameplate, Base Residual Auction for each delivery year: 2025/26 (20 March 2024): tracking solar 14, fixed 9, four-hour storage 59, nuclear 95. 2026/27 (28 February 2025): 11, 8, 50, 95. 2027/28 (1 August 2025): 8, 7, 58, 95. 2028/29 (25 February 2026): 10, 7, 59, 96. 2029/30 (7 August 2026): 7, 6, 57, 96; gas combined cycle 75, onshore wind 37. Preliminary ratings, not binding (4 September 2026), four-hour storage: 42 (2030/31), 34, 30, 26, 24, 23 (2035/36), 19 (2042/43); tracking solar 8 (2030/31), 8, 7, 7, 8, 8 (2035/36), 7 (2042/43); nuclear 96 falling to 92; eight-hour storage 69 for 2029/30. My arithmetic: 1 ÷ 0.07 ≈ 14.3; 1 ÷ 0.57 ≈ 1.75; 1 ÷ 0.96 ≈ 1.04; 1 ÷ 0.23 ≈ 4.3.
PJM’s reasons. 2026 PJM ELCC and Reserve Requirement Study (30 October 2026): winter 96.3% of expected unserved energy in the 2029/30 model (Table 26); fixed solar 4.70% and tracking 7.61% of nameplate in loss-of-load hours (2028/29 run, Table 35); the executive summary on solar and four-hour storage requiring “more total ICAP than the 2027/2028 Capacity Model to serve the same peak load levels”. Sensitivities (Appendix IV, Tables 40 and 43): new large loads modelled as constant all year, four-hour storage 66 and tracking solar 9 for 2029/30; without the 1993/94 winter, four-hour storage 66. Discussion of preliminary ratings (4 September 2026): “flat load shapes”; “storage resources cannot charge other storage resources during winter energy-constrained events in the model”.
The auction. PJM, 2028/2029 Base Residual Auction Report and release (14 July 2026): $325.00 per MW-day, the cap; 138,317.8 MW cleared in the auction, 149,181.6 MW with Fixed Resource Requirement commitments, 6,831.3 MW short of the reliability requirement; cleared and committed capacity 46% gas, 20% nuclear, 18% coal, 1% solar. Next auction opens 9 December 2026 (FERC, 196 FERC ¶ 61,245, 29 September 2026).
Google and Intersect. Google (10 December 2024) and Intersect (10 December 2024); Quantum, Intersect portfolio page: 640 MW solar, 1.3 GWh batteries, operating from June 2026; Meitner, Intersect release (4 June 2026). Roman, Intersect case study “Hybrid Renewable and Gas Solutions Point to the Energy Mix of the Future” (14 October 2026): off-grid, wind and solar primary power backed by batteries, gas reciprocating engines firming; annual carbon emissions expected at least half below the air permit application filed with the Texas Commission on Environmental Quality, which assumes gas running around the clock; Intersect and Google community investment release (14 October 2026) names Meitner and Roman as the two parks in Deaf Smith, Gray and Roberts Counties. Alphabet release (22 December 2025): agreement to acquire Intersect; Intersect (4 June 2026): the purchase closed in March 2026.
Tax law. Public Law 119-21 (4 July 2025), sections 70512 and 70513: sections 45Y and 48E end for wind and solar facilities placed in service after 31 December 2027, unless construction began within 12 months of enactment; energy storage excluded from the termination; full credit for construction beginning before 2034, then 75%, 50% and none; prohibited foreign entity rules for construction beginning after 31 December 2025, storage threshold 55% (2026) to 75% (after 2029). IRS Notice 2025-42 (15 August 2025): physical work test for wind and solar, 5% safe harbour kept only for solar of 1.5 MW or less.
Who is exposed if solar is fast but not firm
This maps who operates in each layer. It is not a recommendation, and naming a company is not a view on its shares. Figures in the piece are disclosures used as evidence for the mechanism.
- Solar and battery builders
- NextEra Energy develops solar and batteries; First Solar makes panels; Tesla makes Megapack grid batteries.
- Campus developers
- Intersect, owned by Alphabet since March 2026, builds solar parks beside data centres.
- Owners of firm power
- Constellation and Vistra own the nuclear and gas plants the grid counts most.
- Grid operators
- PJM and ERCOT rate each plant's firm value.
- On the other side
- AI campuses counting on solar and four-hour batteries alone for round-the-clock power, and solar projects that missed the July 2026 construction start.
Sources: EIA Today in Energy (20 February 2026; 25 March 2022), Electric Power Annual 2025 Table 4.6, Electric Power Monthly Tables 6.07.A and 6.07.B (23 October 2026), and Annual Energy Outlook 2026 Electricity Market Module assumptions (April 2026); California Energy Commission, Demand Analysis Working Group (12 August 2026; 21 November 2024); PJM ELCC class ratings for the 2025/26 to 2029/30 auctions, preliminary ratings to 2042/43 (4 September 2026), 2026 ELCC and Reserve Requirement Study (30 October 2026), and 2028/29 Base Residual Auction report (14 July 2026); FERC, 196 FERC ¶ 61,245 (29 September 2026); Public Law 119-21; IRS Notice 2025-42; Google and Intersect releases (10 December 2024; 4 June 2026; 14 October 2026), Intersect's Roman case study (14 October 2026), Alphabet release (22 December 2025) and Intersect's Quantum page; UC Berkeley Energy Institute working paper WP-356 (February 2026). Personal research, not investment advice.